A truth table already tells you everything about a Boolean function — every input combination and the output it produces. A Karnaugh Map doesn't add new information. It rearranges those same outputs into a grid where related combinations sit next to each other, so grouping and simplification become visible instead of algebraic.
This article walks through that conversion directly: taking rows from a truth table and placing them correctly into K-Map cells, then grouping and simplifying the result.
Truth Table and K-Map: What Changes?
A truth table lists input combinations as rows, one after another, usually in plain binary order. A K-Map takes those same combinations and places them into cells arranged in a grid. The outputs themselves don't change at all — a row that outputs 1 in the truth table still outputs 1 once it's placed on the map. What changes is the arrangement, and that arrangement follows Gray code rather than binary counting order.
If you haven't worked through what a Karnaugh Map is and why that rearrangement matters, it's worth a quick read before continuing here.
This article assumes you already understand the basic grid and focuses on the conversion process.
Step 1: Count the Variables
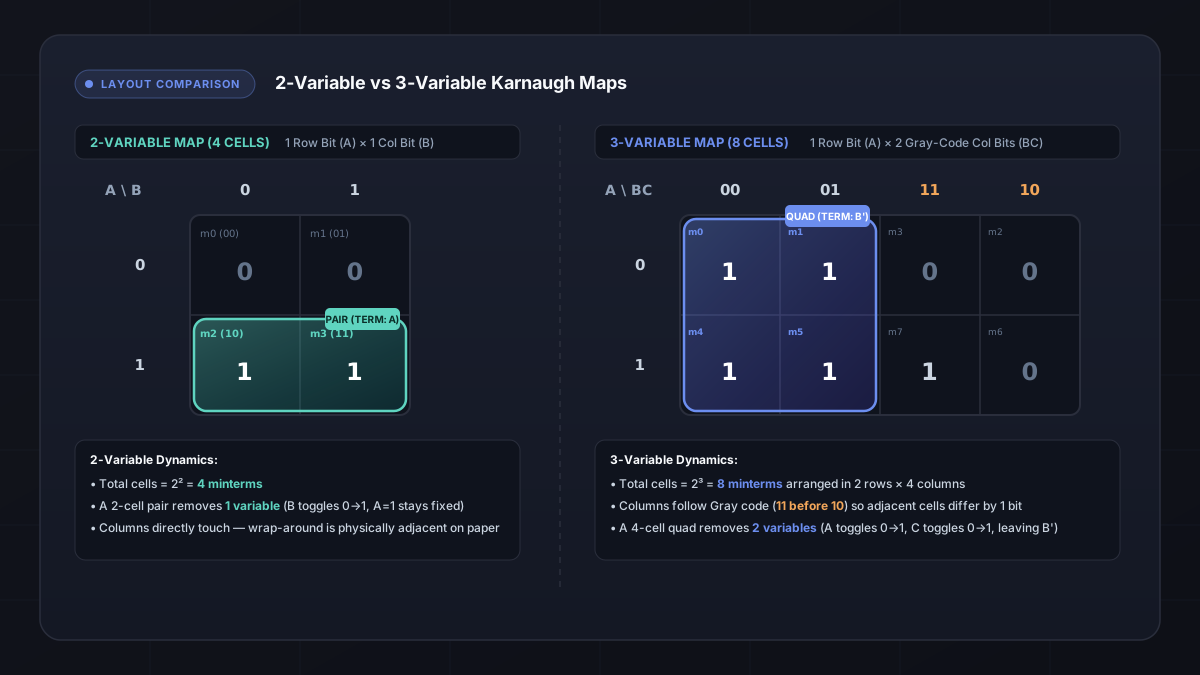
The number of variables in the function determines how many rows the truth table has and how many cells the K-Map needs:
- 2 variables → 4 rows, 4 K-Map cells
- 3 variables → 8 rows, 8 cells
- 4 variables → 16 rows, 16 cells
- 5 variables → 32 combinations
Each variable doubles the number of possible input combinations, since every added variable can independently be 0 or 1. The map size just mirrors that.
Step 2: Identify the Output Column
Once the variable count is settled, look at the output column of the truth table. If you're working toward a Sum-of-Products (SOP) result, the rows that matter are the ones outputting 1. If you're working toward a Product-of-Sums (POS) result, focus on the rows outputting 0 instead.
Some truth tables also include an X in the output column for combinations that are undefined or that can't occur. Those are don't-care values, and they get carried over to the K-Map as X — not automatically treated as a 1.
Step 3: Find the Minterm Numbers
Each row's binary input values correspond directly to a decimal index, called a minterm number. For a 3-variable function with inputs A, B, C, the correspondence looks like this:
- 000 → m0
- 001 → m1
- 010 → m2
- 011 → m3
- 100 → m4
- 101 → m5
- 110 → m6
- 111 → m7
The binary value of ABC, read as a plain binary number, gives you the minterm index.
Rows with a 0 output correspond to the same decimal indices when identifying maxterms for a POS form.
Step 4: Place the Values in Gray Code Order
This is the step that trips people up most often. K-Map rows and columns are not labeled in ordinary binary counting order.
For two-variable axis labels, use:
00, 01, 11, 10
Not:
00, 01, 10, 11
The difference matters because Gray code guarantees that each label differs from its neighbor by exactly one bit.
Going from 01 → 11 changes only the first bit.
Going from 11 → 10 changes only the second bit.
The wrap-around transition 10 → 00 also changes only one bit.
If plain binary order were used instead, the jump 01 → 10 would change both bits at once, and adjacent cells would no longer represent inputs differing in exactly one variable.
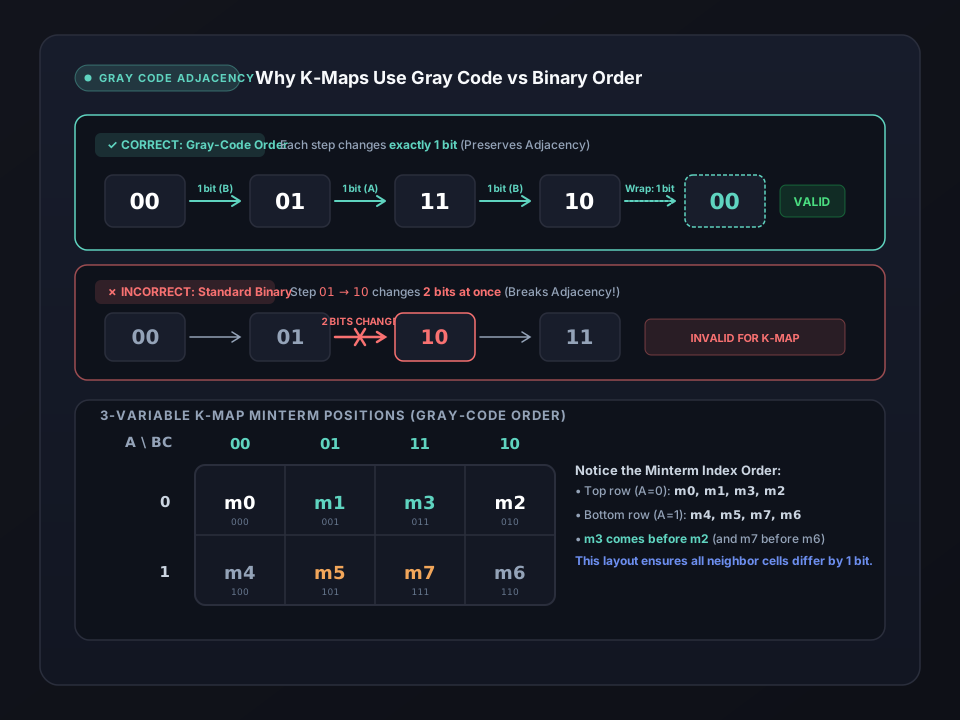
Gray-code order keeps neighboring K-Map columns one bit apart; ordinary binary order would break that adjacency.
Step 5: Fill the K-Map
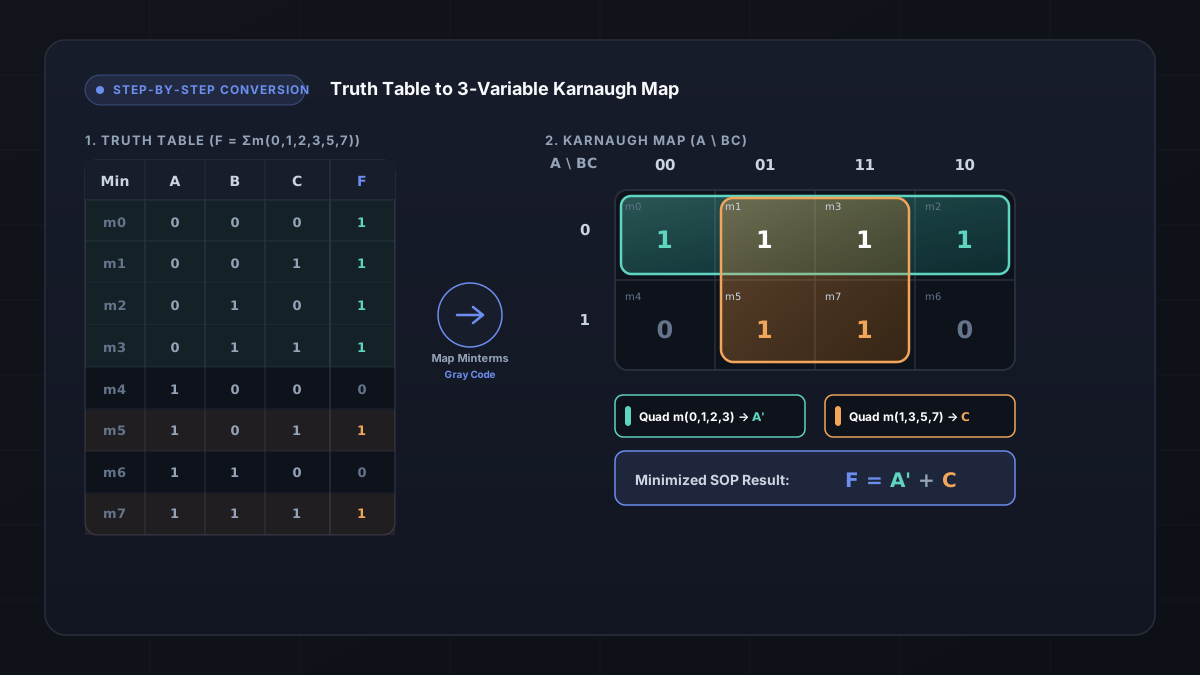
Here's a 3-variable truth table to work through directly:
| A | B | C | F |
|---|---|---|---|
| 0 | 0 | 0 | 1 |
| 0 | 0 | 1 | 1 |
| 0 | 1 | 0 | 1 |
| 0 | 1 | 1 | 1 |
| 1 | 0 | 0 | 0 |
| 1 | 0 | 1 | 1 |
| 1 | 1 | 0 | 0 |
| 1 | 1 | 1 | 1 |
That gives:
F(A, B, C) = Σm(0, 1, 2, 3, 5, 7)
Place these on a 3-variable map with rows for A and columns for BC in Gray-code order:
BC: 00, 01, 11, 10
For A = 0:
m0, m1, m3, m2
All four outputs are 1.
For A = 1:
m4, m5, m7, m6
The values are:
0, 1, 1, 0
Every cell now holds the same output it had in the truth table. Only the visual position changed.
Step 6: Group Adjacent 1s
With the map filled in, look for the largest valid groups of 1s following standard Karnaugh Map grouping rules.
The entire top row m0, m1, m2, m3 forms a quad. All four cells share A = 0.
There is another quad: m1, m3, m5, m7. This is the 2x2 block formed by both A rows across the adjacent BC columns 01 and 11. All four cells share C = 1. This group does not require wrap-around.
The two quads overlap at m1 and m3. That overlap is valid and useful.
Using the larger m1,m3,m5,m7 quad is better than creating only a pair from m5 and m7 because the quad removes an additional variable.
Step 7: Write the Simplified Boolean Expression
Inside a group, variables that stay constant survive in the simplified term. Variables that change disappear.
For m0, m1, m2, m3:
- A stays 0.
- B and C both change.
- The result is
A'.
For m1, m3, m5, m7:
- C stays 1.
- A and B both change.
- The result is
C.
Combining both groups gives:
F = A' + C
Two overlapping quads cover every required 1.
What About POS?
The same truth-table-to-K-Map process works for Product-of-Sums, but the grouping starts from the 0 cells instead of the 1 cells.
Locate the truth-table rows whose output is 0, identify their maxterm indices, place those zeros in the same Gray-code map, and form the largest valid groups.
Each zero-group produces a sum term, and the resulting terms are multiplied together to produce POS.
How to Handle Don't-Care Values
If a truth-table row contains X, carry that X into the corresponding K-Map cell.
Do not decide that it must be 0 or 1 before placing it.
For SOP, an X can be treated like a 1 if doing so allows a larger useful group. Otherwise, leave it unused.
For POS, an X may similarly help extend a zero-group.
A don't-care is optional. Use it only when it improves the simplification.
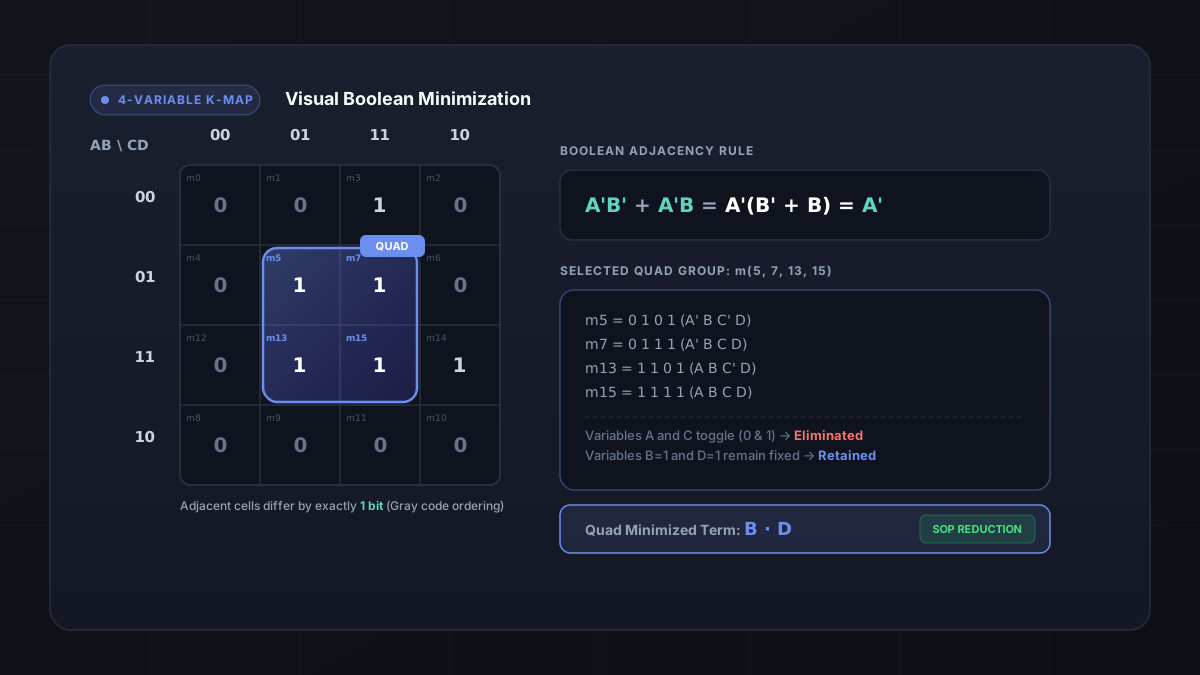
4-Variable Truth Table to K-Map
The process scales directly to four variables.
A 4-variable truth table contains 16 rows and the K-Map contains 16 cells.
A common layout divides the variables across two axes and uses Gray-code order on both:
00, 01, 11, 10
For example, AB can label one axis and CD the other.
The workflow remains the same:
find the row/index → place the output → form valid groups → simplify.
The larger map simply creates more opportunities for wrap-around and overlapping groups.
Common Conversion Mistakes
- Laying out the K-Map in ordinary binary order instead of Gray code.
- Placing an output in the wrong cell after confusing the minterm index with its visual position.
- Treating diagonal cells as adjacent.
- Forgetting that opposite edges can be adjacent.
- Creating groups of 3, 6, or another non-power-of-two size.
- Forcing a don't-care X into a group where it gives no benefit.
- Mixing SOP and POS grouping rules.
- Stopping at a smaller group when a larger valid group is available.
A Quick Truth Table to K-Map Checklist
- Count the variables.
- Read the output column.
- Identify the minterm or maxterm indices.
- Set up the K-Map in Gray-code order.
- Place each 0, 1, or X in the correct cell.
- Form the largest useful valid groups.
- Find the simplified term from each group.
- Combine the terms.
- Verify the result against the original truth table.
Checking Your Result
Once you have the simplified expression, confirm that it produces the same output as the original truth table for every input that is not a don't-care.
Try several rows manually, or compare the full set of outputs.
If you want to compare your manual conversion with an automated result, the Karnaugh Map Solver can build the K-Map from the same truth-table values and show its grouping.
Frequently Asked Questions
How do I convert a truth table to a Karnaugh Map?
Count the variables, identify each row's minterm index, and place the output in the matching K-Map cell using Gray-code ordering. The outputs stay the same; only their positions change.
How do I know which K-Map cell matches a truth-table row?
Read the row's input bits as a binary number to get its decimal minterm index, then find that minterm's position in the Gray-code map.
Why does a K-Map use Gray code?
Gray code makes neighboring cells differ by only one bit. That single-variable difference is what allows adjacent cells to be grouped and simplified.
Do I put zeros in a K-Map?
Yes. Every truth-table output belongs in the K-Map. For SOP you usually group the 1s, while for POS you group the 0s.
What does X mean in a truth table or K-Map?
X is a don't-care condition. It can be used as either value when that helps create a better group, or ignored when it provides no simplification benefit.
Can K-Map groups overlap?
Yes. A cell can belong to multiple valid groups when the overlap helps produce a simpler Boolean expression.